
There are massive discrepancies between economies in terms of their energy transition strategy.
To illustrate this, I chose 9 countries:
3 large energy producers with important domestic demand (BRA, USA, AUS),
3 mature economies with both LNG imports and nuclear generation legacy (FRA, GER, JPN),
3 developing economies with strong demographic dimension (CHN, IND, EGY).
I purposely kept Solar and Wind out of the picture because (i) they are still massively subsidised, (ii) coal consumption stands as a proxy indicator to renewables switching, and (iii) I didn’t want to overload my charts with data.
Click on each chart below and see my comments at the end of the post.
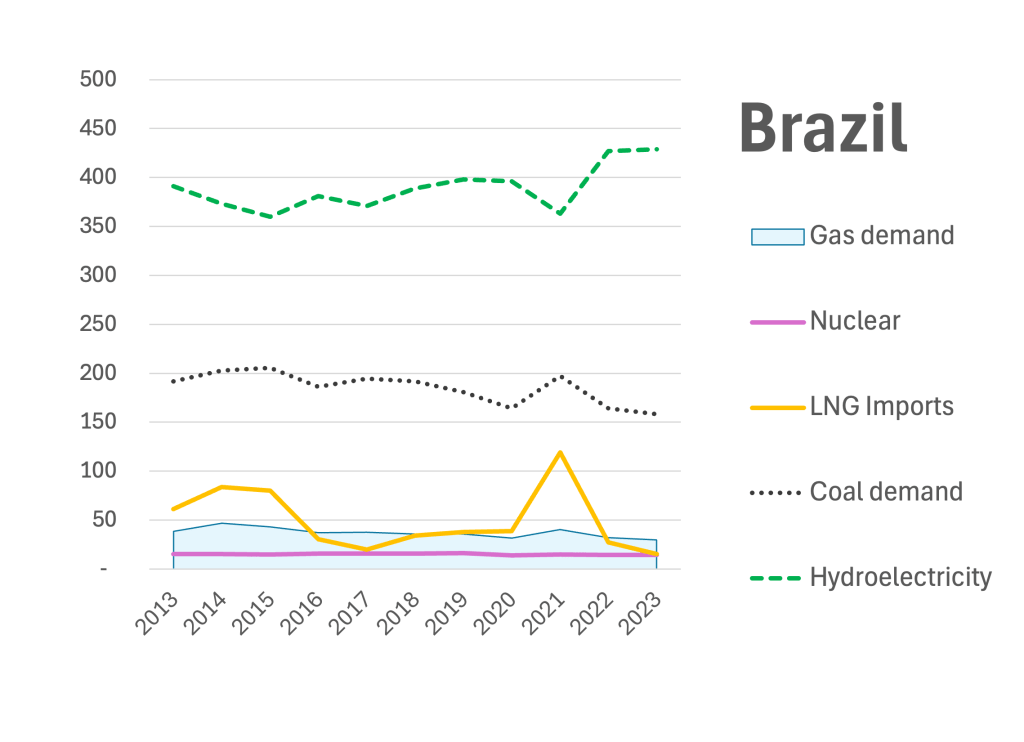


Brazil is blessed with hydro resources: Gas & LNG will remain a flexibility, last resort tool.
USA increased there LNG exports by 300% in 5 years. Still, it’s just a drop in their “gas ocean”. Note the coal phase out, a sign that renewables are doing the job.
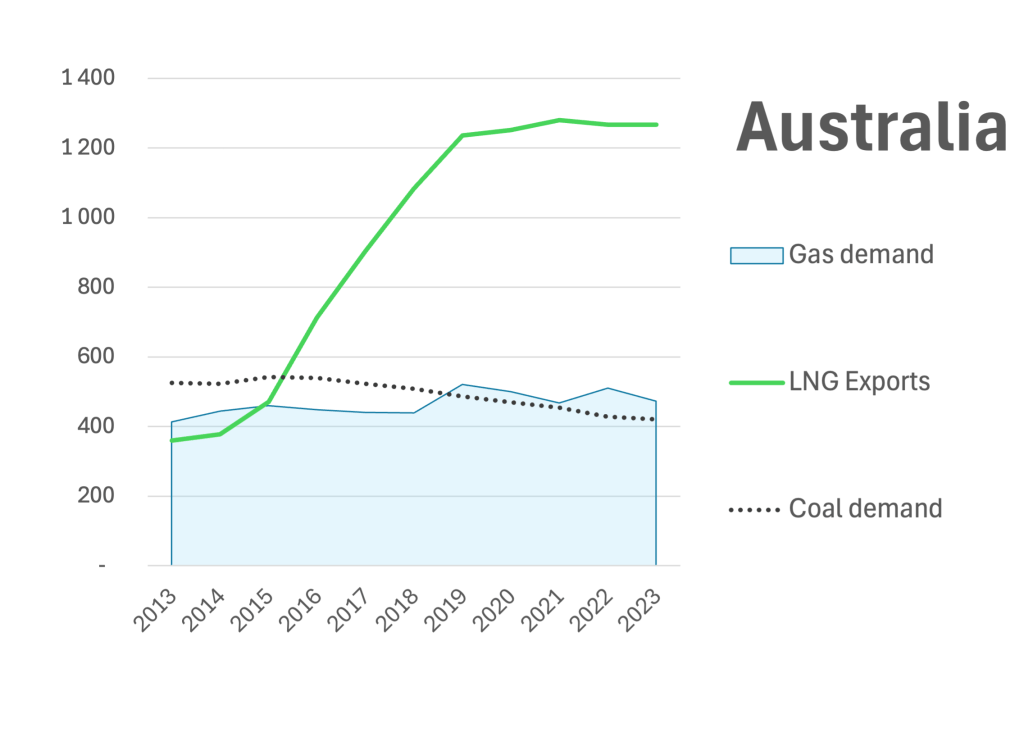
Australia is heavily relying on its coal, has steady domestic gas demand but its LNG exports skyrocketed in 3 years time, creating a political debate on the price of the commodity.
France, which boasts the worlds’ most important share of nuclear generation in the power mix, is now reinvesting in new nuclear plants after a pause in the early 2010’s. Its LNG imports are symptomatic of the Russia-Ukraine conflict, and not only destined to its own market.
Germany, with an important domestic coal production, a ban of nuclear and a profound gas crisis, is at the mercy of new LNG imports – watch out the 2024 updates.
Japan, as expected from an island, is matching its gas demand with LNG imports. Its coal demand remains in the same order of magnitude.
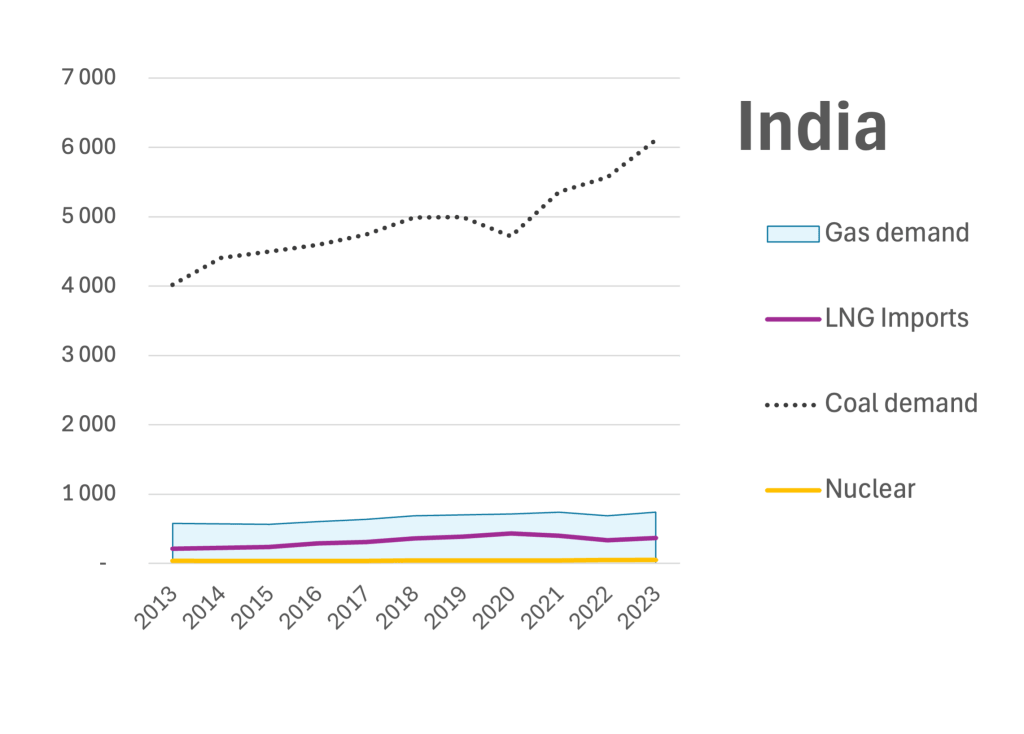
China and India gas and nuclear numbers are dwarfed by coal. This illustrates the immense potential of coal-to-gas switching (which saves 50% of GHG emissions for power generation).
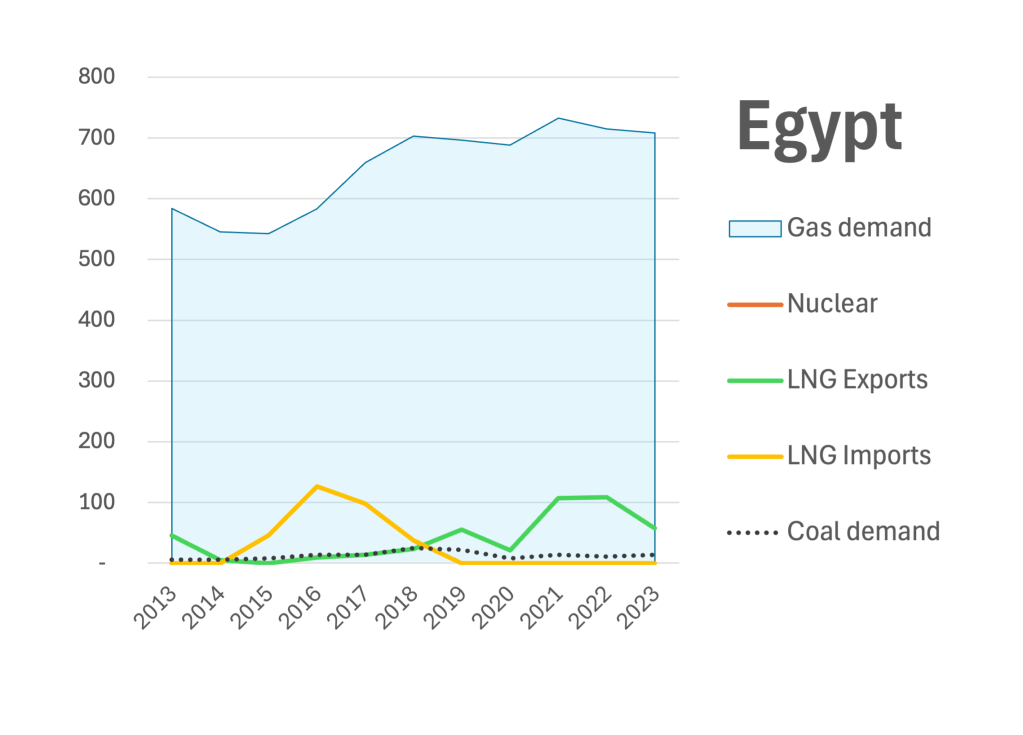
Egypt is struggling with a growing domestic gas demand, preventing it from keeping the LNG exports flow and now forcing it to switch back to LNG imports.
Bottomline: Geography and demography are key parameters. Politics are supposed to do the rest, but they often fail to get the long term vision and to be honest with their electors…
Source : energyinst.org/statisticalreview. Data converted to TWh using 11,8 kWh/m3.
